This post is also available in: polski (Polish)
Implementation of innovative methods of impedance tomography to study the condition of flood embankments.
The importance of this problem has been shown by the floods in Poland and around the world. The measurement and monitoring system could detect imminent danger in advance.
The aim of the project is to develop a modern system for testing and monitoring the condition of flood embankments.
The proposed solution is an innovative product, which is a cutting-edge and modern method that is uncommon in this form in the market due to the technologies used, as well as the complexity and variety of algorithms for reconstructing the properties of the testes objects.
The main elements of the project:
- development of new algorithms used for determining the distribution of conductivity
- creating innovative methods of examining the condition of embankments
- creating new algorithms for monitoring the condition of embankments online
- constructing a prototype of the system.
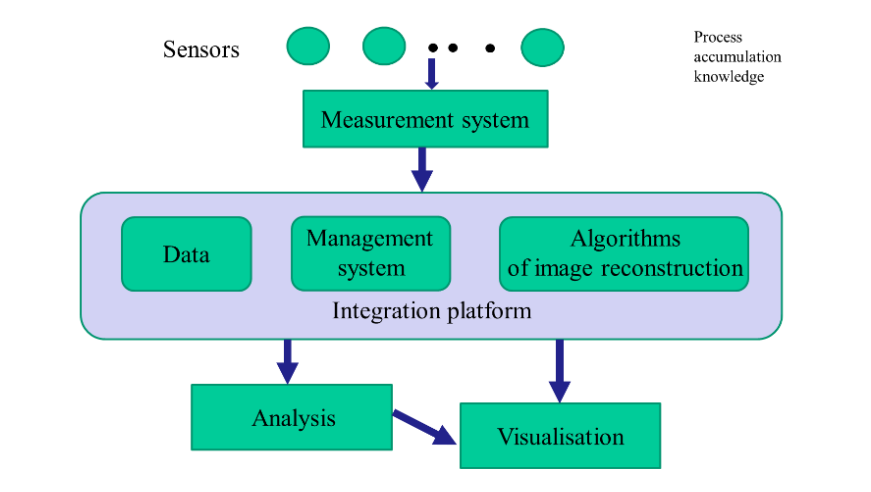
The monitoring system is composed of the following elements (Fig.1):
- measurement electrodes
- data collecting system
- data base
- management (control) system,
- image reconstruction algorithms
- analysis module
- visualization module.

Different types of failures may occur in flood embankments, such as: piping, slope erosion, micro-instability, drifting ice, slip circle of the outer slope, wave overtopping, water overflow and liquefaction (fig.2).
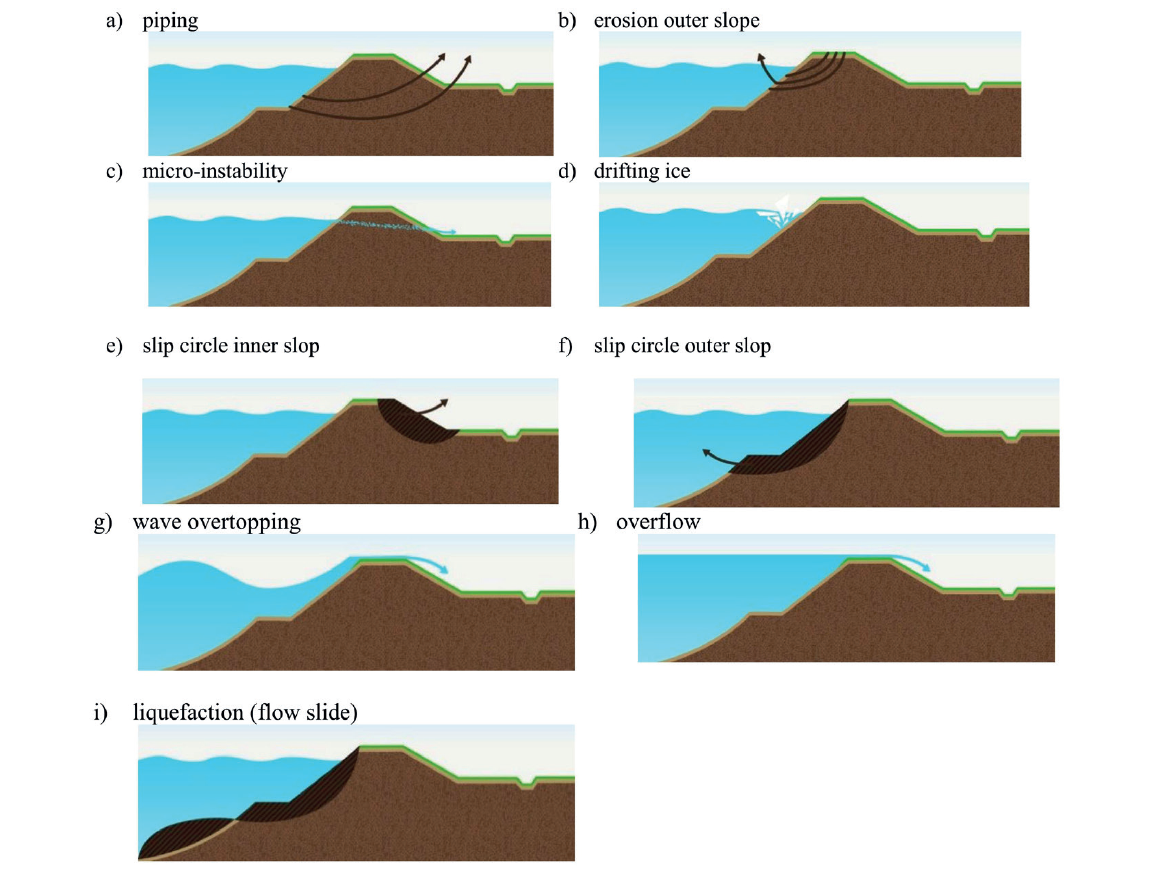

Fig.2 Examples of flood embankment failures.
The measurement system is based on the impedance tomograph model. An excitation source is connected to two electrodes. The remaining electrodes are used for measurements of the voltage at the edge of the area. Measurements are performed for all possible ways of connecting a power source in order to increase the amount of information about the object and enhance the signal-to-noise ratio. When the first series of measurements is completed, the excitation system is switched over to the adjacent electrodes. The measurement process is repeated sequentially for all possible connection systems of the excitation source (Fig.3)

Fig.3. Arrangement of elements on the bank of the flood embankment
Image reconstruction was based on the optimization method, in which the way to determine the solution is to minimize the objective function as the mean square error value of the reconstruction referred to the inter-electrode voltage vector.
In order to calculate the simple problem and to determine the potential component and the curvature change component, another algorithm uses the finite element method, the subdomain boundary method or the boundary element method. The internal objects of the studied space are described by the level set function which is discretized on a fixed Cartesian grid. Gradient methods and computational intelligence algorithms are also used for the optimization task.
The following numeric procedure was proposed:
- zero level set function is initialized, including an unknown shape,
- the Laplace equation is solved in the studied area,
- the difference between the calculated and measured potential is determined
- the conjugate equation to the state equation is solved
- the velocity component normal to the boundary is determined
- the level set function is updated
- reinitialization is performed.
The solution process is repeated as long as satisfactory convergence conditions are achieved.
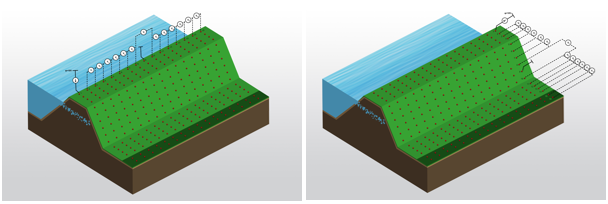
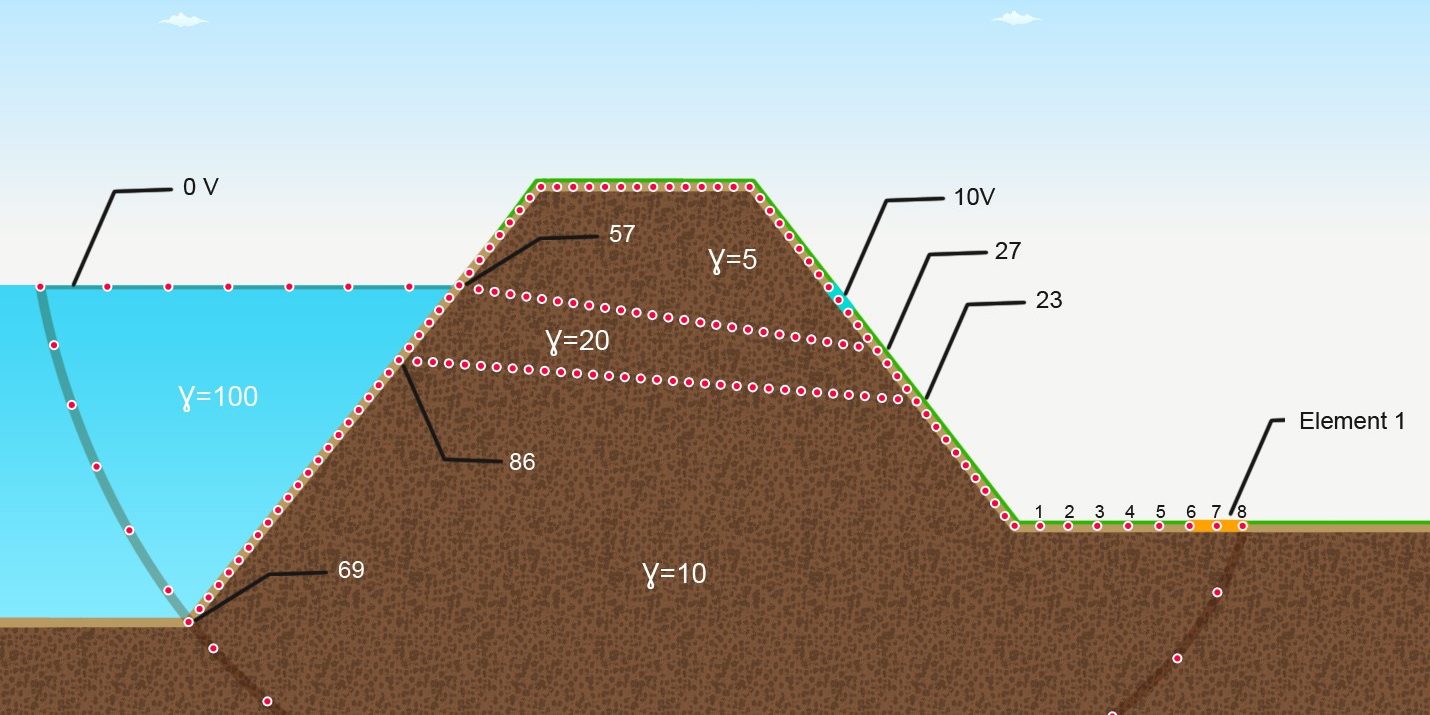
Fig.4 Model of a typical flood embankment. The figure shows the electrodes of the control system (tomograph).
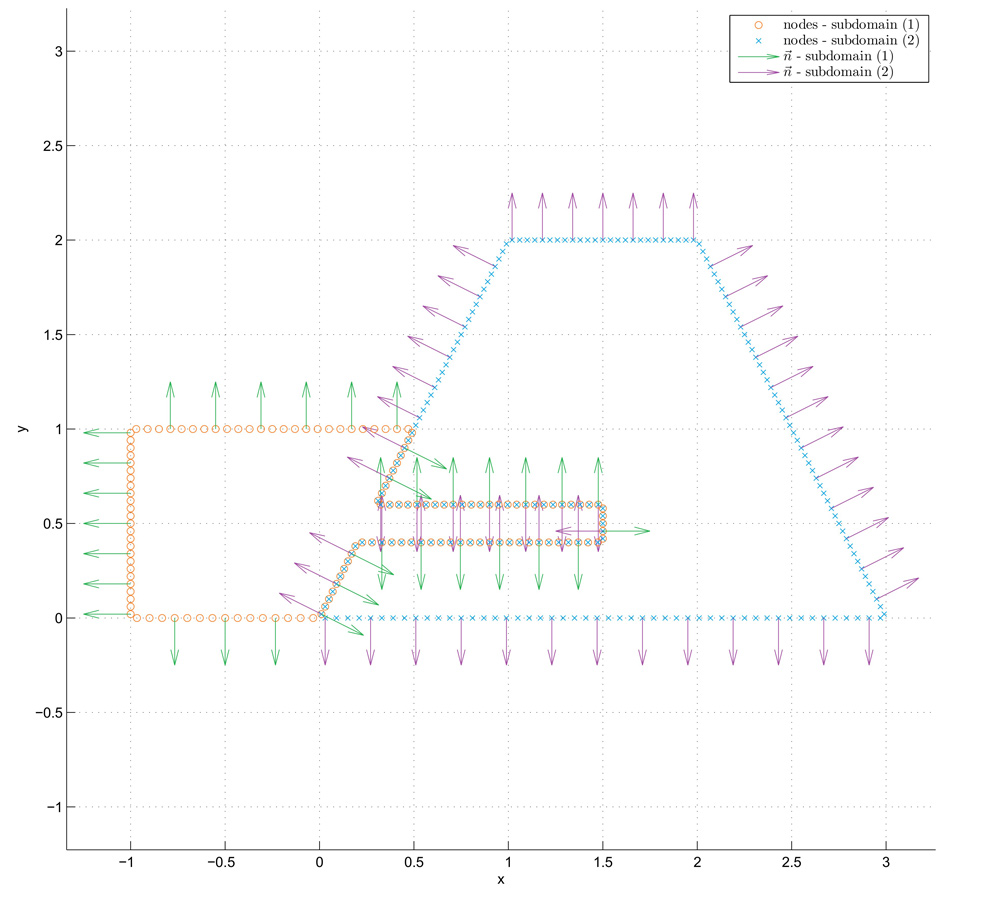
Fig.5 Two-dimensional geometric model of a damaged embankment. The model was prepared in order to solve a simple problem using the boundary element method. The nodes of boundary elements and normal vectors were marked.
System data communication and processing concept
The distribution of the measuring electrodes is presented in the diagram below.
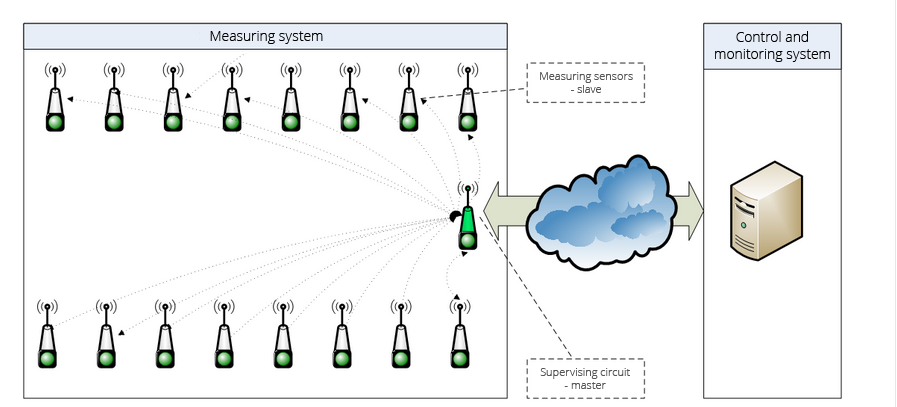

The system, due to its roles, includes primarily:
- variable frequency source,
- multiplexer,
- data acquisition system,
- control module with signal processor.

Fig.7. Data acquisition system diagram
A 16-electrode measurement data collection system was developed for the electrical impedance system. Its model is presented in the figure below.
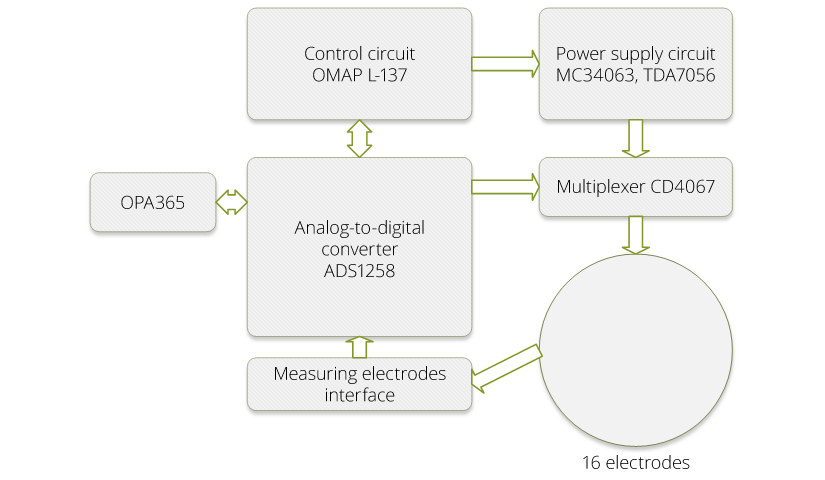

Fig. 8 Model of the system
The main elements of the 16-electrode data acquisition system for the electrical impedance tomography system are:
- 24-bit, 16-channel analog to digital converter,Analog multiplexers (CD4067) are responsible for selectively switching the voltage from the power supply system to individual electrodes,
- The power supply system based on the MC34063 chip and the TDA7056 amplifier provides alternating voltage with an amplitude from 0.5 to 10 V and frequencies up to 10 kHz,
- Measuring container with 16 measuring electrodes made of chromium-nickel alloy and shielded cables with a resistance of 50 Ω,
- An operational amplifiers system (OPA365) creating an input/output buffer also aiming at decreasing and shifting the drift to very low levels.
The project is co-financed from the European Union funds.


